

IELTS Bar Graph Essay: Internet Usage in Different Age Groups in 2020
The bar graph below shows the percentage of internet users in different age groups in 2020. Summarize the information by selecting and reporting the main features and making comparisons where relevant.
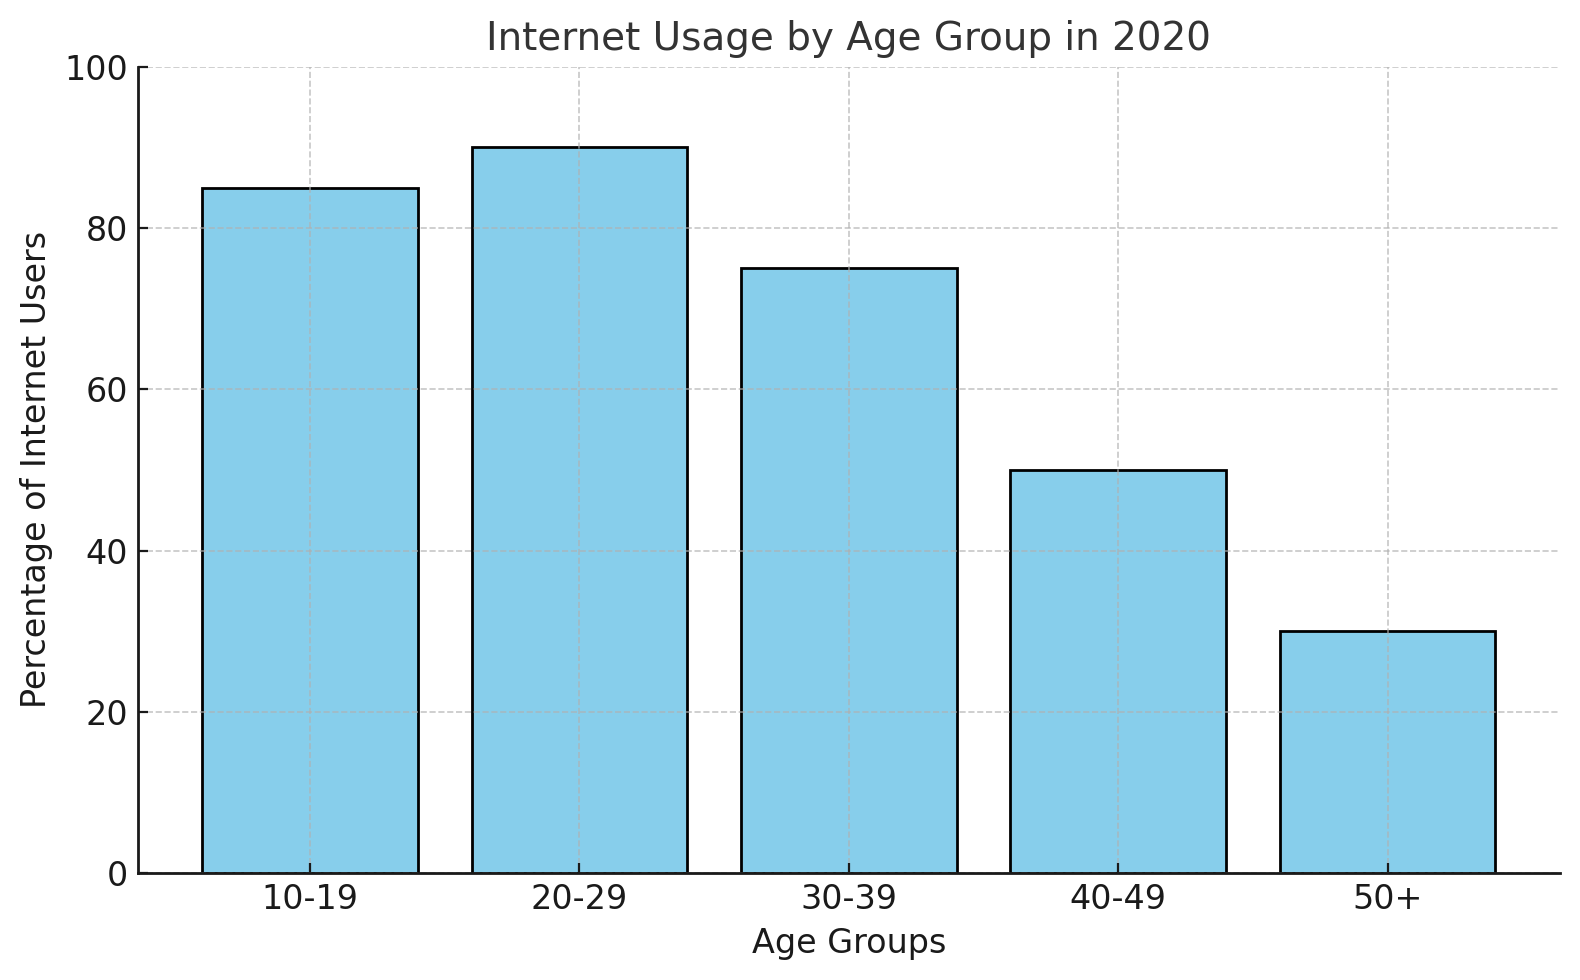
The bar graph illustrates the percentage of internet users across five distinct age groups in 2020. The age groups are categorized as 10–19, 20–29, 30–39, 40–49, and 50 and above.
Overall, the graph highlights that younger age groups had higher internet usage compared to older ones, with the 20–29 age group being the most active users. In contrast, internet usage significantly declined among individuals aged 50 and above.
The 20–29 age group recorded the highest percentage of internet users, with nearly 90% participation. This was closely followed by the 10–19 age group, where around 85% of individuals were active on the internet. Similarly, the 30–39 age group also showed substantial internet engagement, with approximately 75% usage.
However, internet usage decreased sharply for individuals aged 40–49, dropping to about 50%. The lowest percentage of internet users was observed among those aged 50 and above, where only 30% reported using the internet.
In summary, internet usage in 2020 was significantly higher among younger age groups, particularly those between 10 and 29 years old, while older age groups, especially those over 50, showed much lower levels of engagement.


0 Comments